Daily Dashboard
Introduction
The Daily Dashboard provides a quick overview of scenario activity, execution results, value created, and error trends.

You can track what’s happening across scenarios in real time and measure your overall Fusion automation performance.
The dashboard layout is fixed and includes a standard set of widgets. It comes in two variants, depending on your License type:
Professional — without KPI widgets
Enterprise — includes KPI widgets (available only with Enterprise license)
You see one of these versions based on your license.
The displayed data reflects your selection of period, team, and scenario folders.
Dashboard Filters and Controls
Use built-in controls to tailor dashboard data:
Scenario folder picker
Time period selector
Scenario activity filter
Team selector
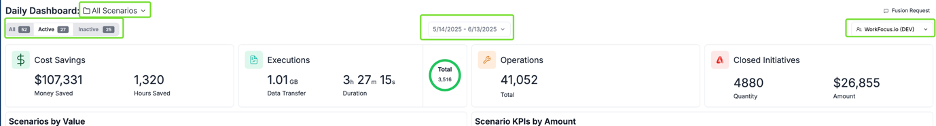
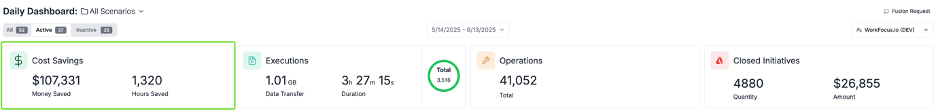
Cost Saving Feature
See total value created by Fusion automation and man-hours saved across selected scenarios.
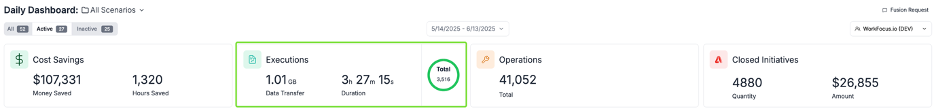
Executions Widget
View the number of scenario executions, broken down by result: Success, Warning, and Failed. It includes data transfer and duration metrics.
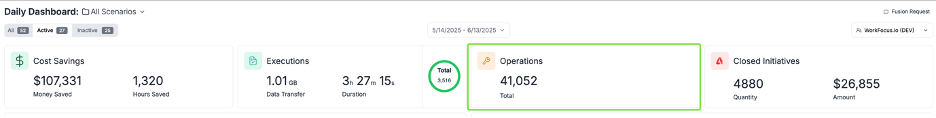
Operations Widget
Track Fusion operations consumed by selected scenarios.
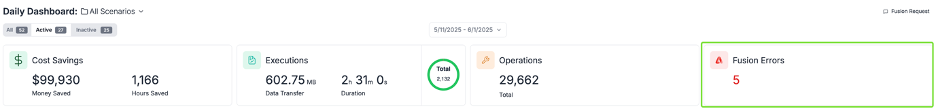
Fusion Errors Widget
(Professional license only) See total Fusion errors raised by selected scenarios during the selected period.
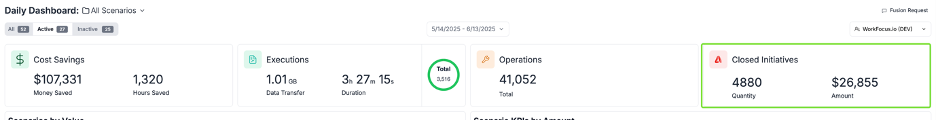
Selected KPI Widget
(Enterprise license only) Monitor one KPI metric’s quantity and amount across selected scenarios.
Scenarios by Value
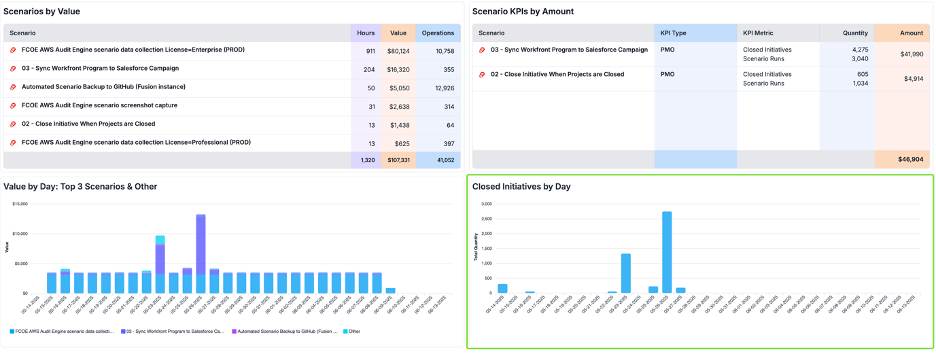
View a list of scenarios that generated the highest value during the selected time. The table includes columns for value, hours saved, and operations used.
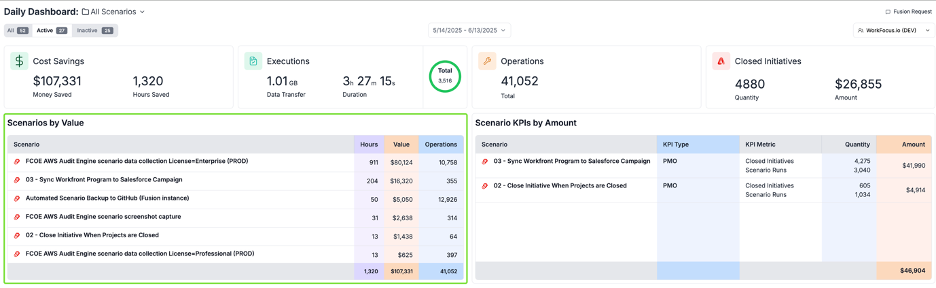
Scenario KPIs by Amount
(Enterprise license only) See scenarios with configured KPI metrics (requires prior KPI metrics setup and modification of the Fusion scenario to enable KPI metrics reporting). The widget shows the following data for each scenario over the selected period:
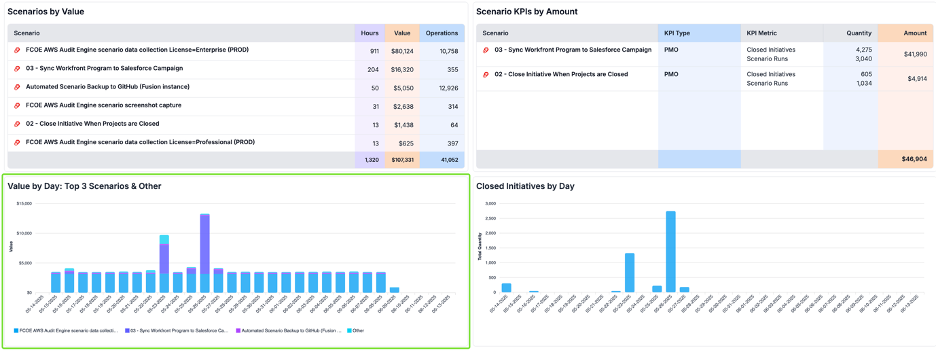
Scenario name
KPI type
KPI metric
Quantity
Amount
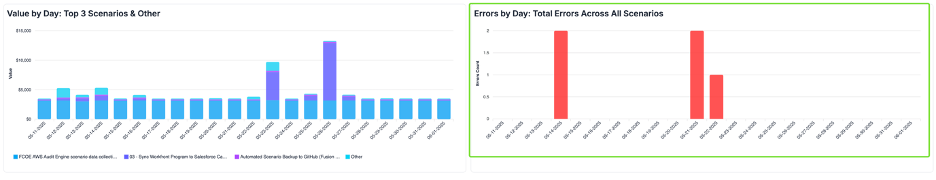
Chart – Scenario Value by Day (Top 3)
See daily value trends for the top 3 scenarios, plus combined value of all others.
Chart – Selected KPI by Day (Top 3)
(Enterprise license only) Visualize how a selected KPI metric evolves day by day.
Scenarios by Errors Table
(Professional license only) Display scenarios with the most Fusion errors. Sorted by error count.
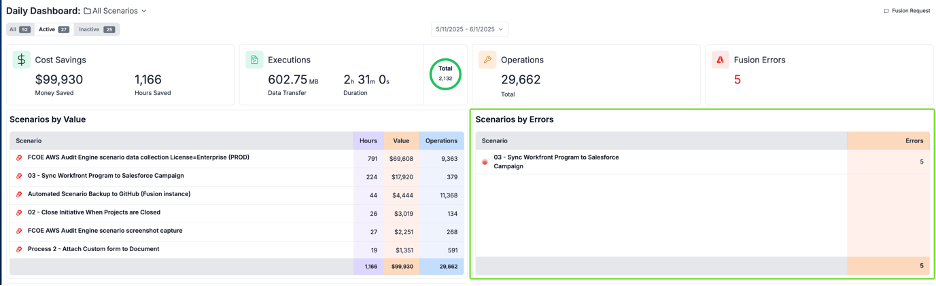
Chart – Fusion Errors by Day
(Professional license only) View the number of Fusion errors per day across selected scenarios.